Finance
Top Candlestick Patterns That Influence Trading
Having originated in Japan over 100 years before the West developed their own financial trading charts, a candlestick chart is a style of financial charts used to describe price movements of a security, derivative, or currency, based on their past movements. This type of chart is particularly useful as they visually represent the size of an asset’s price movement via four price points (open, close, high, and low) throughout a specified period of time.
Each individual candlestick has three main components: the body, the wicks, and the color. The body represents the open-to-close range of the asset at a given time. The wick (or shadow) displays the intra-day highest and lowest prices. Finally, the candlestick’s color represents which direction in the market the asset went, either up (usually connotated by Green or Filled-In candles) or down (show in Red or Outlined candles).
As individual candlesticks form patterns that traders can use to recognize major support and resistance levels and because this type of chart is most used by retail brokerage firms–like LegacyFX, it is therefore imperative for one to fully understand how candlestick patterns work so that they can improve one’s trading results.
This article will explore how candlestick patterns can be used in one’s trading strategies, 4common candlestick patterns that every trader should be aware of, and their benefits.
How to Use Candlestick Patterns?
Candlestick patterns typically consist of up to five or six consecutive candles in either an ascending or descending order. Based on their behavior after appearing, candlestick patterns are generally classified into three categories: Bullish, Bearish, and Neutral. Other classifications include reversals (which predicts a price change) and continuations (which indicate extensions in the current price trend).
Such clusters of candlesticks can aid traders to interpret market sentiments, predict market reactions, gain perspective on the buying and selling pressure balance, as well as market indecision. In most cases, traders use them to decide whether to enter or exit a trade. However, relying solely on such patterns can prove to be costly. Therefore, it is recommended to take into consideration other financial and trading factors and implement security or risk protocols as well, when executing trades.
Common Candlestick Patterns Found in Trading
- Bullish Engulfing Pattern
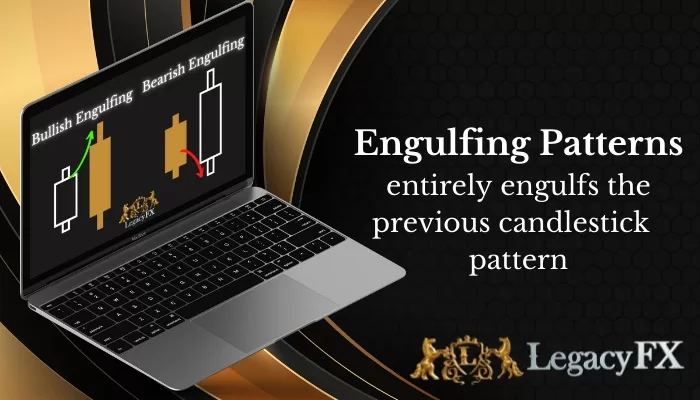
The Bullish Engulf Pattern forms when two opposing-colored candlesticks appear, with the second being more significant than the first. This typically signals a potential rise in price, as the first candle is red (bearish), followed by a more prominent green (bullish) candle. They are most prominent when formed at the bottom of a bearish trend, as it signals that more buyers have entered the market, thereby pushing the price upward and reversing the previous trend.
Generally, traders view bullish engulfing patterns as a buying signal. This type of signal is easy to spot because the pattern consists of only two candles, one of which is large and easily recognizable. Another advantage of using this engulfing pattern is that traders can benefit from a favorable risk-to-reward ratio once completed.
- Bearish Engulfing Pattern
A Bearish Engulfing Pattern is the inverse of a Bullish Engulfing Pattern, as it indicates that the bears have overcome the bulls and are pushing an asset upward. As such, this pattern typically appears at the top of an upward movement.
This pattern is formed when the first candle is green (bullish), immediately followed by a larger red (bearish) candle. Since the second candle is red, it predicts that the price will fall.
Using this pattern in trading has two significant advantages. First, they are simple indicators for investors to recognize when they should possibly exit out of a position. Second, because the Bearish Engulfing Pattern frequently occurs, especially in the forex market, it opens more trading opportunities for new investors wishing to diversify their portfolios.
- Three White Soldiers
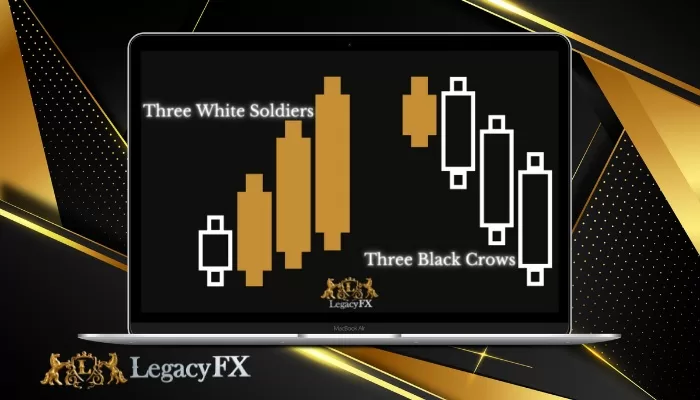
This particular pattern occurs over three time frames, thereby using three candlesticks. It consists of three consecutive long green (or gold) candles with small wicks, which open and close progressively higher than the previous day. It is a very strong bullish signal that occurs after a downtrend and shows a steady advance of buying pressure.
- Three Black Crows
Opposingly, the three black crows candlestick pattern comprises of three consecutive long red candles with short or non-existent wicks. Each session opens at a similar price to the previous day, but selling pressures push the price lower and lower with each close. Traders tend to interpret this pattern as the start of a bearish downtrend, as the sellers have overtaken the buyers during three successive trading days.
- Morning Star
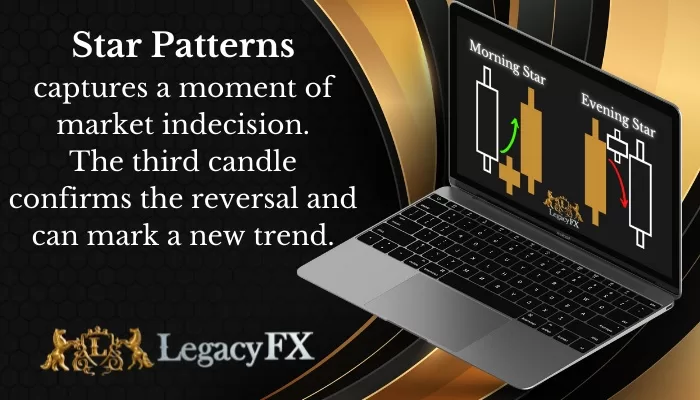
A morning star is a three-candle pattern that signals a downward trend reversal, by appearing at the bottom of a bearish trend. The pattern indicates extreme selling by the first candle, followed by a shift in power in the second–yet smaller candle, and finalized by a third larger bullish candle taking over and regaining lost ground.
- Evening Star
This pattern is the opposite of the previous pattern mentioned. It too comprises of three candles: two with large bodies and a smaller candle in between. Due to this candle’s position in between and at the top of the two other candles, the Evening Star tends to predict a drop of an asset’s price.
Advantages of Spotting Candlestick Patterns in Your Next Trade
As a new trader, one might find candlesticks with strange indicators challenging and perplexing. Yet one must remember that they are important signals of price changes. Therefore, they are good indicators of times to buy or sell. Their simplicity, easy recognition, and cooperation with other market indicators can allow one to make more informed and timely market decisions. So join us–at LegacyFXand see if you can spot some of these patterns in your next trade.

