Finance
Candlestick Trading Patterns – 101
For a trader to create a solid trading strategy, they need to perform analysis on candlestick charts. This requires one to assess the entire chart as a whole instead of looking at just a single candle. Candlesticks can either have long or short bodies. The former reflects higher selling or buying pressure, while the latter indicating minimal price movement plus consolidation. Observing the length of a candlestick’s body assists in determining whether to go for a long or short position. Doing so will also enable you to find bullish or bearish patterns to use as signals. Besides these two pattern classifications, there is a multitude of different patterns that are used. Below please find a rudimentary list of popular patterns seen in today’s markets. To learn more about trading strategies, visit the LegacyFX Academy.
Bullish Candlestick Pattern
This pattern portrays a rise in currency pair prices. Bullish candles usually indicate buying pressure.
Bearish Candlestick Pattern
This is mostly seen when the total number of sellers surpasses the total number of buyers (i.e., more supply versus demand). Bearish candlesticks typically form when prices go down.
Engulfing Candlestick Pattern
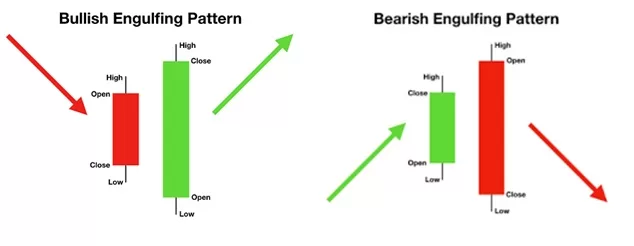
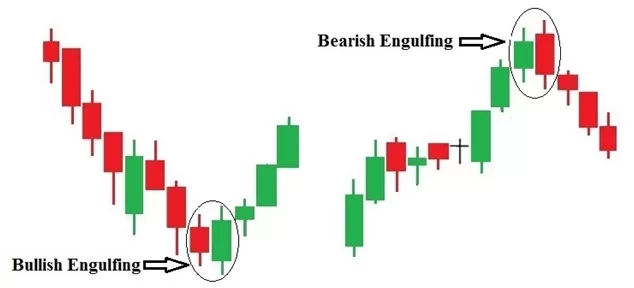
This type of pattern usually signals a reversal of the market trend. It involves two candles, with the latter larger candle body overcoming or ‘engulfing’ the entire body of the smaller candle before it. The engulfing candle can be bullish or bearish depending on its forms in relation to the prior existing trend.
Harami Candlestick Pattern
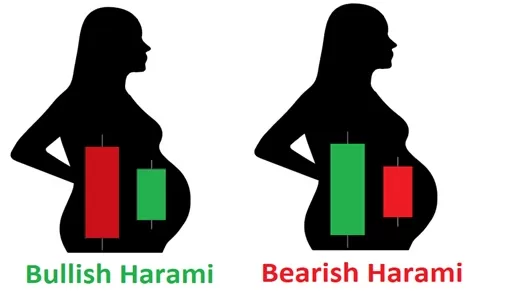
This pattern is represented by two candlesticks, the larger, followed by a second smaller one. Its name is derived from the Japanese word for “pregnant” as the formation of these candlesticks resembles a pregnant woman, with the larger one being the woman and the smaller one being the baby inside. Overall, this pattern is considered a reversal pattern type, as the second smaller candlestick is entirely contained within the first one and opposite in colour. Like the previous engulfing pattern, this one can also be either bullish or bearish in nature.
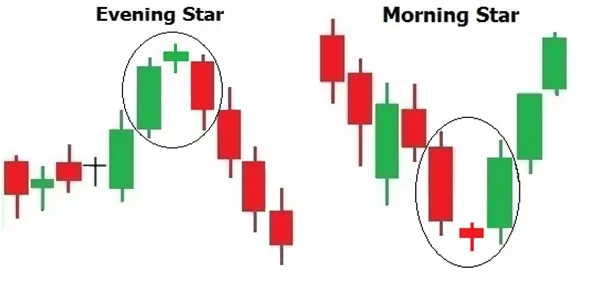
Evening Star & Morning Star Candlestick Patterns
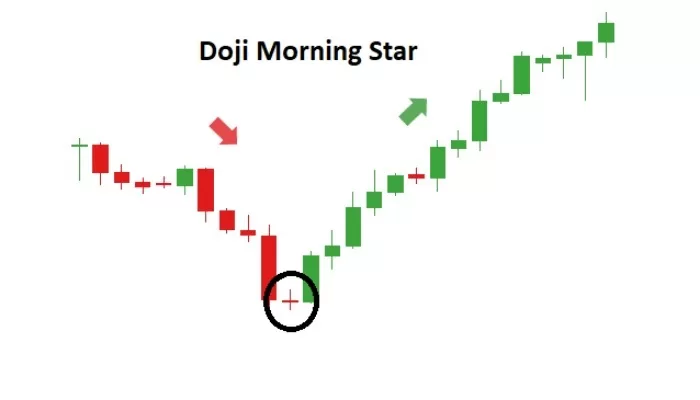
This is a bearish reversal pattern consisting of 3 candlesticks. The first candlestick signals an uptrend, followed by a second smaller upward-moving candlestick. Finally, however, the third candlestick reverses downward, opening below the previous candle and closing well below the midpoint of the first candle. This pattern is considered to be a reliable indicator that a downward trend has begun. Opposingly, the morning star is a bullish reversal pattern usually following a downward trend. The first candlestick is long and black/red-bodied in this pattern, followed by a short candlestick that has gapped lower. These two candles are then completed by a long-bodied white/green candlestick that closes above the midpoint of the first candlestick.
Marubozu Candlestick Pattern
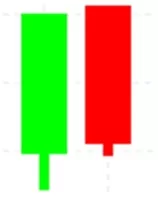
Unlike other candlestick patterns, this one does not have wicks. This is because it shows that an instrument has traded and closed strongly in either a bullish or bearish way without the price being driven in the opposite direction at any point during the time period. Thus, this pattern can be indicative of both a trend continuation or reversal.
Spinning Tops Candlestick Pattern
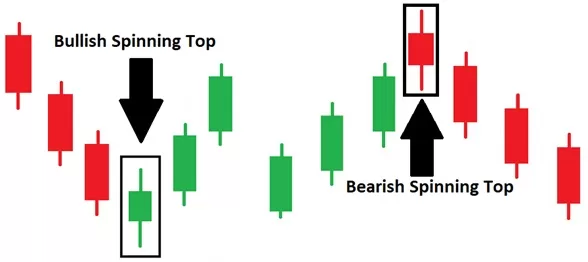
Spinning tops are characterized by a relatively small body and long wicks and tails, reflecting indecision in the marketplace. In this pattern, candlesticks close somewhere near the open price point, which can help predict reversals.
Doji Candlestick Pattern
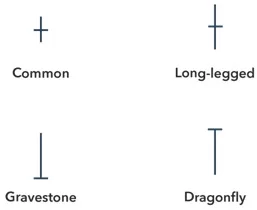
This type of patterns forms when a security’s open and close price are virtually equal resulting in little to no body. Coming from the Japanese word for a mistake, this type of pattern is rare to find in modern-day charts. Like the spinning top’s pattern, dojis also indicate indecision and the possibility of reversal. There are four main types of doji candlesticks: Common, Long-legged, Gravestone, and Dragonfly.
Hammer Candlestick Pattern
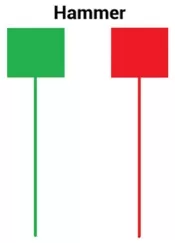
This price pattern is when a security trades lower than its opening price yet ultimately closes near its original opening. This forms a hammer-shaped candlestick with a long tail and small upper body.
Shooting Star Candlestick Pattern
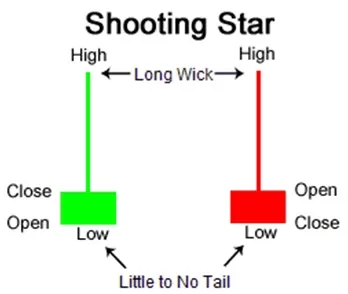
A shooting star is a bearish candlestick pattern characterized by candles with a long upper wick, little or no lower tail, and a small body. These types of candles typically appear after an upward trend in the market.
Overall, every type of candlestick pattern indicates a transition between a bearish and bullish market. Learn more about the best trading techniques and strategies at the LegacyFX Academy.
