Travel
Cathay Pacific releases combined traffic figures for March 2015

Cathay Pacific Airways today released combined Cathay Pacific and Dragonair traffic figures for March 2015 that show a double-digit increase in the number of passengers carried compared to the same month in 2014, along with a smaller increase in the cargo and mail uplift.
Cathay Pacific and Dragonair carried a total of 2,887,106 passengers in March – an increase of 11.0% compared to the same month last year. The passenger load factor grew by 5.0 percentage points to 87.3% while capacity, measured in available seat kilometres (ASKs), increased by 5.7%. For the first quarter of 2015, passenger traffic grew by 8.6% while capacity was up by 6.9%
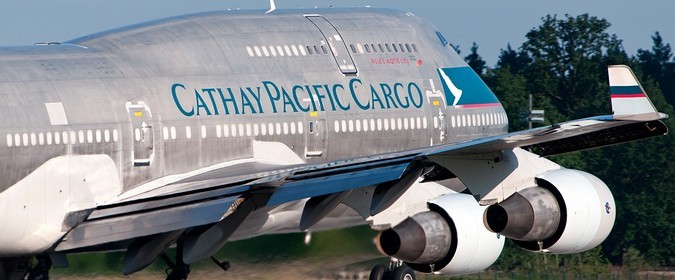
The two airlines carried 157,688 tonnes of cargo and mail last month, an increase of 1.5% compared to March 2014. The cargo and mail load factor rose by 1.7 percentage points to 68.4%. Capacity, measured in available cargo/mail tonne kilometres, fell by 0.1% while cargo and mail revenue tonne kilometres (RTKs) flown rose by 2.4%. For the first quarter of 2015, tonnage rose by 12.3% against a capacity increase of 9.8% and a 15.4% rise in RTKs.
Cathay Pacific General Manager Revenue Management Patricia Hwang said: “March is traditionally a shoulder season between the Chinese New Year and Easter peak periods, but this year saw passenger demand for the month rising above expectations. Demand was strong in all cabins, with high load factors to and from Southwest Pacific, Europe and the UK. Demand on the US routes caught up with the big increase in capacity introduced last year, while travel in the region was generally strong, particularly to Japan, Thailand and Singapore.”
Cathay Pacific General Manager Cargo Sales & Marketing Mark Sutch said: “Air freight demand was generally robust throughout March, helped by the month-end and quarter-end production rush out of the key manufacturing cities in Mainland China. Once again the main focus of our business was on the transpacific lanes, with traffic into and out of North America spurred by the continuing congestion in sea ports on the West Coast of the USA. Demand to Europe remained below expectations, with business affected by the ongoing economic woes and the depreciation of the euro.”
CATHAY PACIFIC / DRAGONAIR COMBINED TRAFFIC |
MAR
2015 |
% Change
VS MAR 14 |
Cumulative
MAR 2015 |
% Change
YTD |
| RPK (000) | ||||
| – Mainland China | 756,604 | 7.0% | 2,132,674 | 2.3% |
| – North East Asia | 1,316,337 | 9.7% | 3,816,571 | 11.5% |
| – South East Asia | 1,476,581 | 18.8% | 4,163,414 | 16.0% |
| – India, Middle East, Pakistan & Sri Lanka | 711,372 | -2.0% | 1,997,979 | -2.0% |
| – South West Pacific & South Africa | 1,507,998 | 29.5% | 4,385,701 | 15.3% |
| – North America | 2,754,971 | 7.5% | 7,936,416 | 10.4% |
| – Europe | 1,668,262 | 12.2% | 4,745,923 | 7.8% |
| RPK Total (000) | 10,192,125 | 12.2% | 29,178,678 | 10.0% |
| Passengers carried | 2,887,106 | 11.0% | 8,175,619 | 8.6% |
| Cargo and mail revenue tonne km (000) | 929,258 | 2.4% | 2,549,254 | 15.4% |
| Cargo and mail carried (000kg) | 157,688 | 1.5% | 435,429 | 12.3% |
| Number of flights | 6,617 | 6.9% | 19,186 | 6.2% |
CATHAY PACIFIC / DRAGONAIR COMBINED CAPACITY |
MAR
2015 |
% Change
VS MAR 14 |
Cumulative
MAR 2015 |
% Change
YTD |
| ASK (000) | ||||
| – Mainland China | 966,676 | 2.5% | 2,789,460 | -0.5% |
| – North East Asia | 1,566,921 | 6.9% | 4,706,562 | 9.2% |
| – South East Asia | 1,736,058 | 17.2% | 5,046,660 | 13.7% |
| – India, Middle East, Pakistan & Sri Lanka | 848,269 | -10.2% | 2,431,503 | -10.8% |
| – South West Pacific & South Africa | 1,644,138 | 12.6% | 4,938,104 | 9.4% |
| – North America | 3,050,392 | 1.5% | 9,033,811 | 9.7% |
| – Europe | 1,868,226 | 7.0% | 5,412,073 | 5.9% |
| ASK Total (000) | 11,680,680 | 5.7% | 34,358,173 | 6.9% |
| Passenger load factor | 87.3% | 5.0pt | 84.9% | 2.3pt |
| Available cargo/mail tonne km (000) | 1,358,248 | -0.1% | 3,874,525 | 9.8% |
| Cargo and mail load factor | 68.4% | 1.7pt | 65.8% | 3.2pt |
| ATK (000) | 2,468,973 | 2.4% | 7,141,774 | 8.5% |


